Showing posts with label graphing. Show all posts

Wednesday, October 24, 2012

Birthday Graphs

This week in Math we learned about how to read simple graphs - both vertical and horizontal. So as a class we created a vertical and horizontal graph using our birthdays and our age. Then we wrote down our results. Then as a class we asked questions about our graph. 
  • Is there more 5 year old or more 6 year olds?
  • How many more 5 year olds are there than 6 year olds?
  • How many birthdays are in November & December combined? 
  • Which month had the least amount of birthdays?

They did amazing answering all the questions and even creating their own questions! Check out our results and I hope you had a chance to look at your child's graph that they brought home. 

Our horizontal graph showing which month our birthdays are in.


Saturday, October 1, 2011

All About Apples!

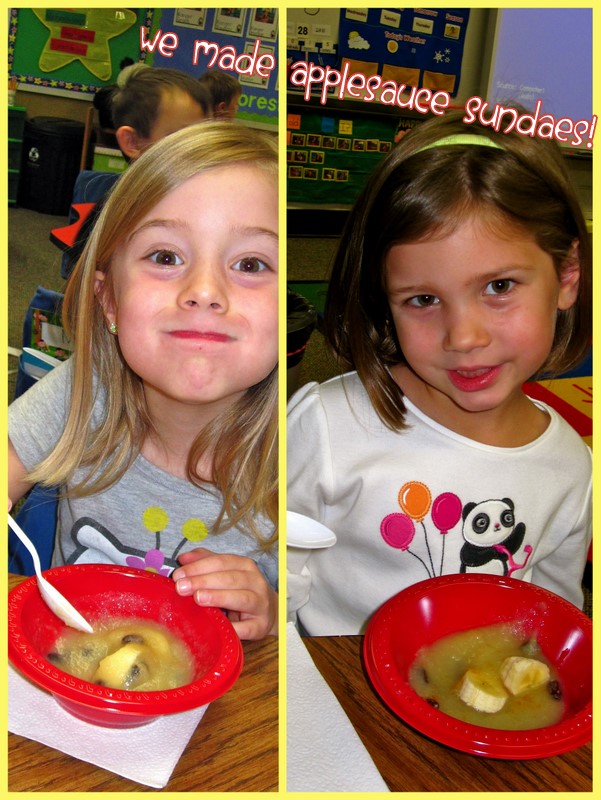
Well we just finished our Science Apple Week! We read a story about apples everyday (Johnny Appleseed, Ten Apples Up on Top, Apples, and The Seasons of Arnold's Apple Tree). The students love learning about how apples are created, the different types of apples, and the uses for apples! Throughout the week they had the opportunity to taste apples in a variety of different ways. We made apple smiles and apple sundaes and we tried warm cinnamon apples, apple juice, and apple jacks. We even tasted a yellow, green and red apple and each student voted on their favorite one. During math we ended up graphing it and red apples had the most (9), then yellow (5), and lastly was the green apples (4). During work stations we also created some fun apple projects that will be up during our Fall Open House! We hope you will be there to check it out! For now, enjoy our pictures from our week! P.S. You can click on the pictures to enlarge them!